

어스틴 (오스틴) 텍사스 부동산 뉴스 & 소식 (주택, 집, 콘도, 타운홈, 상업용 부동산)
Most affordable housing markets
Most affordable housing markets
Indianapolis come in first among big cities; Los Angeles dead last. Nearly 200 markets rated according to income and home prices.
NEW YORK (CNNMoney.com) - Indianapolis was the leader among all major U.S. cities for housing affordability during the first quarter of 2006, according to the latest figures from the National Association of Home Builders and Wells Fargo.
More than 90 percent of homes in the Indiana capital were affordable to families earning the median income for the area of about $65,100.
In Los Angeles, the least affordable big metro area, only 1.9 percent of the homes sold were within the reach of families earning a median income for the city of $56,200.
For the United States as a whole, housing grew less affordable over the past 12 months.
NAHB president David Pressley said, "The latest HOI (housing affordability index) shows that only 41.3 percent of new and existing homes that were sold during this year's first quarter were affordable to families earning the national median income. This is down from just over 50 percent of all homes sold in the first quarter of 2005."
In addition to housing prices and family income the survey bases its index on interest rates. First-quarter housing affordability was virtually unchanged compared with the fourth quarter of 2005 because slightly higher family income and a small dip in home prices were offset by an increase in mortgage loan interest rates.
Among all cities, including smaller ones, Lansing, Michigan ranked as the most affordable metro area surveyed. Some 92.7 percent of all homes sold there could be bought by families earning the median income in town.
The Midwest dominated the top 10 list with Davenport, Iowa second at 92.3 percent and Lima, Ohio third at 91.2 percent. Only one other region cracked the top 10 with Cumberland, Maryland representing the South at 88.2 percent.
The most unaffordable markets were almost all in California with Santa Ana (2.5) and Santa Barbara (3.2) just a tiny bit more affordable than LA. The New York metro area, the only non-Golden State in the bottom 10, came in tenth, tied with Nassau-Suffolk, New York, at 6.1 percent. ![]()
Housing Opportunity Index: 1st Quarter 2006 by Affordability Rank | |||||
| Affordability refers to the percentage of homes sold in the first quarter that families making the median household income for that metro area could afford to buy. Income and home prices are medians and are in thousands of dollars. | |||||
| Metro Area | Affordability | Income | Home prices | National rank | Regional rank |
| Lansing-East Lansing, MI | 92.7 | 64.9 | 108 | 1 | 1 |
| Davenport-Moline-Rock Island, IA-IL | 92.3 | 60.1 | 85 | 2 | 2 |
| Lima, OH | 91.2 | 52.2 | 75 | 3 | 3 |
| Battle Creek, MI | 90.5 | 55.2 | 80 | 4 | 4 |
| Indianapolis, IN | 90.1 | 65.1 | 113 | 5 | 5 |
| Bay City, MI | 89.4 | 55.8 | 85 | 6 | 6 |
| Saginaw-Saginaw Township North, MI | 89.4 | 53.8 | 75 | 6 | 6 |
| Springfield, OH | 88.8 | 55.4 | 86 | 8 | 8 |
| Cumberland, MD-WV | 88.2 | 48.4 | 78 | 9 | 1 |
| Youngstown-Warren-Boardman, OH-PA | 88.2 | 52.1 | 82 | 9 | 9 |
| Canton-Massillon, OH | 87.8 | 54.9 | 93 | 11 | 10 |
| Detroit-Livonia-Dearborn, MI* | 86.9 | 56.7 | 95 | 12 | 11 |
| Monroe, MI | 86.5 | 69.6 | 141 | 13 | 12 |
| Mansfield, OH | 86.0 | 52.7 | 88 | 14 | 13 |
| Rochester, NY | 85.8 | 64.1 | 105 | 15 | 1 |
| Erie, PA | 85.7 | 54.3 | 85 | 16 | 2 |
| Flint, MI | 85.6 | 57.8 | 98 | 17 | 14 |
| Buffalo-Niagara Falls, NY | 85.5 | 58.3 | 77 | 18 | 3 |
| Grand Rapids-Wyoming, MI | 83.6 | 61.5 | 127 | 19 | 15 |
| Dayton, OH | 83.3 | 59.8 | 105 | 20 | 16 |
| Toledo, OH | 83.2 | 58.9 | 104 | 21 | 17 |
| St. Louis, MO-IL | 83.1 | 65.8 | 109 | 22 | 18 |
| Harrisburg-Carlisle, PA | 82.9 | 64.3 | 129 | 23 | 4 |
| Akron, OH | 82.4 | 61.3 | 105 | 24 | 19 |
| Warren-Farmington Hills-Troy, MI* | 81.8 | 79.5 | 161 | 25 | 20 |
| Peoria, IL | 81.1 | 62.4 | 108 | 26 | 21 |
| Cleveland-Elyria-Mentor, OH | 80.3 | 61.4 | 118 | 27 | 22 |
| Sandusky, OH | 80.3 | 60.2 | 119 | 27 | 22 |
| Champaign-Urbana, IL | 80.0 | 62.6 | 127 | 29 | 24 |
| Oklahoma City, OK | 78.7 | 53.9 | 110 | 30 | 2 |
| Springfield, IL | 78.5 | 64.6 | 119 | 31 | 25 |
| Columbia, SC | 78.0 | 58.9 | 127 | 32 | 3 |
| Tulsa, OK | 77.7 | 54.5 | 118 | 33 | 4 |
| Winston-Salem, NC | 77.6 | 58.2 | 129 | 34 | 5 |
| Cincinnati-Middletown, OH-KY-IN | 76.6 | 64.6 | 136 | 35 | 26 |
| Pittsburgh, PA | 76.0 | 57.4 | 114 | 36 | 5 |
| Greensboro-High Point, NC | 73.8 | 56.4 | 135 | 37 | 6 |
| Ann Arbor, MI | 73.3 | 82.4 | 200 | 38 | 27 |
| Atlanta-Sandy Springs-Marietta, GA | 73.2 | 68.1 | 175 | 39 | 7 |
| Fayetteville, NC | 73.0 | 47.6 | 117 | 40 | 8 |
| Columbus, OH | 71.8 | 64.4 | 150 | 41 | 28 |
| Pocatello, ID | 71.8 | 50.2 | 131 | 41 | 1 |
| Pueblo, CO | 71.7 | 46.8 | 125 | 43 | 2 |
| Milwaukee-Waukesha-West Allis, WI | 71.3 | 66.8 | 156 | 44 | 29 |
| Charlotte-Gastonia-Concord, NC-SC | 71.2 | 64.4 | 160 | 45 | 9 |
| Lancaster, PA | 71.2 | 64.1 | 163 | 45 | 6 |
| Reading, PA | 70.0 | 64.6 | 155 | 47 | 7 |
| Wilmington, DE-MD-NJ* | 68.4 | 73.2 | 199 | 48 | 8 |
| Fort Worth-Arlington, TX* | 67.4 | 63.1 | 157 | 49 | 10 |
| Great Falls, MT | 67.3 | 47.8 | 133 | 50 | 3 |
| Springfield, MA | 67.0 | 62.9 | 175 | 51 | 9 |
| Raleigh-Cary, NC | 65.8 | 71.6 | 197 | 52 | 11 |
| Ogden-Clearfield, UT | 64.8 | 61.2 | 186 | 53 | 4 |
| Tallahassee, FL | 64.6 | 58.5 | 166 | 54 | 12 |
| Durham, NC | 64.3 | 61.7 | 175 | 55 | 13 |
| Duluth, MN-WI | 64.0 | 55.7 | 134 | 56 | 30 |
| Hartford-West Hartford-East Hartford, CT | 63.6 | 80.2 | 216 | 57 | 10 |
| Colorado Springs, CO | 63.4 | 63.1 | 200 | 58 | 5 |
| Spokane, WA | 63.1 | 53.9 | 152 | 59 | 6 |
| Fort Collins-Loveland, CO | 63.0 | 68.6 | 219 | 60 | 7 |
| Minneapolis-St. Paul-Bloomington, MN-WI | 63.0 | 78.5 | 230 | 60 | 31 |
| Gainesville, GA | 62.5 | 58.3 | 168 | 62 | 14 |
| Denver-Aurora, CO | 62.4 | 71.3 | 221 | 63 | 8 |
| Camden, NJ* | 62.2 | 77.3 | 195 | 64 | 11 |
| Dallas-Plano-Irving, TX* | 61.8 | 66.7 | 177 | 65 | 15 |
| Roanoke, VA | 61.4 | 57.8 | 175 | 66 | 16 |
| Richmond, VA | 60.9 | 67.2 | 203 | 67 | 17 |
| San Antonio, TX | 59.6 | 53.1 | 143 | 68 | 18 |
| Wheeling, WV-OH | 59.6 | 48.2 | 141 | 68 | 18 |
| Pensacola-Ferry Pass-Brent, FL | 59.0 | 51.9 | 159 | 70 | 20 |
| New Haven-Milford, CT | 58.8 | 75.0 | 215 | 71 | 12 |
| Salem, OR | 58.5 | 56.8 | 180 | 72 | 9 |
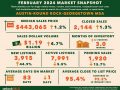
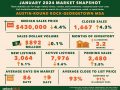
| Austin-Round Rock, TX | 58.3 | 69.6 | 197 | 73 | 21 |
| Trenton-Ewing, NJ | 57.8 | 85.4 | 225 | 74 | 13 |
| Allentown-Bethlehem-Easton, PA-NJ | 57.4 | 65.9 | 185 | 75 | 14 |
| Norwich-New London, CT | 56.4 | 73.9 | 233 | 76 | 15 |
| Fort Walton Beach, FL | 56.0 | 57.8 | 194 | 77 | 22 |
| Greeley, CO | 55.8 | 57.8 | 193 | 78 | 10 |
| Houston-Sugar Land-Baytown, TX | 55.6 | 60.9 | 171 | 79 | 23 |
| Lake County-Kenosha County, IL-WI* | 54.9 | 86.0 | 257 | 80 | 32 |
| Pittsfield, MA | 54.9 | 61.2 | 185 | 80 | 16 |
| Boulder, CO | 54.8 | 81.6 | 282 | 82 | 11 |
| Jacksonville, FL | 54.8 | 60.3 | 192 | 82 | 24 |
| Asheville, NC | 54.3 | 50.4 | 170 | 84 | 25 |
| Corvallis, OR | 53.6 | 68.1 | 226 | 85 | 12 |
| Greenville, SC | 52.8 | 56.5 | 183 | 86 | 26 |
| Virginia Beach-Norfolk-Newport News, VA-NC | 52.6 | 60.3 | 200 | 87 | 27 |
| Ocala, FL | 51.9 | 44.9 | 148 | 88 | 28 |
| Vineland-Millville-Bridgeton, NJ | 51.5 | 56.4 | 163 | 89 | 17 |
| Chicago-Naperville-Joliet, IL* | 51.3 | 72.1 | 241 | 90 | 33 |
| Gainesville, FL | 51.2 | 54.5 | 176 | 91 | 29 |
| Rockingham County-Strafford County, NH * | 51.0 | 77.0 | 250 | 92 | 18 |
| Charleston-North Charleston, SC | 50.7 | 56.4 | 201 | 93 | 30 |
| Salisbury, MD | 50.7 | 55.3 | 191 | 93 | 30 |
| Salt Lake City, UT | 50.1 | 61.3 | 223 | 95 | 13 |
| Baltimore-Towson, MD | 49.1 | 72.8 | 250 | 96 | 32 |
| Albuquerque, NM MSA | 48.6 | 53.2 | 193 | 97 | 14 |
| Worcester, MA | 47.4 | 71.7 | 250 | 98 | 19 |
| Provo-Orem, UT | 46.4 | 56.0 | 216 | 99 | 15 |
| Yuma, AZ | 45.8 | 41.1 | 150 | 100 | 16 |
| Palm Bay-Melbourne-Titusville, FL | 45.3 | 57.3 | 205 | 101 | 33 |
| El Paso, TX | 44.2 | 39.5 | 126 | 102 | 34 |
| Manchester-Nashua, NH | 44.2 | 76.9 | 245 | 102 | 20 |
| Philadelphia, PA* | 44.0 | 69.8 | 251 | 104 | 21 |
| Tampa-St. Petersburg-Clearwater, FL | 43.8 | 54.4 | 194 | 105 | 35 |
| Eugene-Springfield, OR | 43.4 | 54.7 | 202 | 106 | 17 |
| Punta Gorda, FL | 43.4 | 50.8 | 185 | 106 | 36 |
| Bellingham, WA | 42.8 | 57.5 | 223 | 108 | 18 |
| Portland-Vancouver-Beaverton, OR-WA | 42.5 | 66.9 | 250 | 109 | 19 |
| Brownsville-Harlingen, TX | 42.2 | 33.0 | 109 | 110 | 37 |
| Lakeland, FL | 41.8 | 49.5 | 186 | 111 | 38 |
| Hagerstown-Martinsburg, MD-WV | 40.4 | 57.7 | 238 | 112 | 39 |
| Olympia, WA | 38.9 | 64.3 | 237 | 113 | 20 |
| Bremerton-Silverdale, WA | 38.6 | 63.2 | 247 | 114 | 21 |
| Cambridge-Newton-Framingham, MA* | 38.6 | 90.9 | 365 | 114 | 22 |
| Bethesda-Gaithersburg-Frederick,MD* | 38.0 | 98.4 | 390 | 116 | 40 |
| Essex County, MA* | 37.2 | 78.2 | 319 | 117 | 23 |
| Panama City-Lynn Haven, FL | 36.8 | 51.6 | 220 | 118 | 41 |
| Kingston, NY | 35.3 | 61.4 | 229 | 119 | 24 |
| Atlantic City, NJ | 35.0 | 64.4 | 250 | 120 | 25 |
| Poughkeepsie-Newburgh-Middletown, NY | 34.8 | 73.4 | 265 | 121 | 26 |
| Deltona-Daytona Beach-Ormond Beach, FL | 34.4 | 50.3 | 200 | 122 | 42 |
| Honolulu, HI | 34.4 | 71.3 | 378 | 122 | 22 |
| Tucson, AZ | 34.3 | 52.4 | 223 | 124 | 23 |
| Prescott, AZ | 34.2 | 48.3 | 229 | 125 | 24 |
| Orlando-Kissimmee, FL | 33.9 | 57.4 | 235 | 126 | 43 |
| Fort Lauderdale-Pompano Beach-Deerfield Beach, FL* | 33.8 | 60.6 | 242 | 127 | 44 |
| Vero Beach, FL | 33.6 | 55.5 | 222 | 128 | 45 |
| Boise City-Nampa, ID | 33.5 | 56.1 | 234 | 129 | 25 |
| Bridgeport-Stamford-Norwalk, CT | 33.0 | 95.9 | 415 | 130 | 27 |
| Phoenix-Mesa-Scottsdale, AZ | 32.9 | 60.1 | 255 | 131 | 26 |
| Mount Vernon-Anacortes, WA | 32.7 | 56.5 | 242 | 132 | 27 |
| Seattle-Bellevue-Everett, WA* | 32.6 | 74.3 | 326 | 133 | 28 |
| Tacoma, WA* | 31.0 | 61.0 | 249 | 134 | 29 |
| Edison, NJ* | 30.8 | 87.5 | 340 | 135 | 28 |
| West Palm Beach-Boca Raton-Boynton Beach, FL* | 30.5 | 64.4 | 295 | 136 | 46 |
| Sarasota-Bradenton-Venice, F | 29.1 | 58.4 | 265 | 137 | 47 |
| Newark-Union, NJ-PA* | 28.7 | 85.4 | 365 | 138 | 29 |
| Chico, CA | 26.9 | 49.7 | 250 | 139 | 30 |
| Bend, OR | 26.6 | 58.8 | 275 | 140 | 31 |
| Carson City, NV | 25.5 | 57.3 | 280 | 141 | 32 |
| Cape Coral-Fort Myers, FL | 25.3 | 56.0 | 258 | 142 | 48 |
| Boston-Quincy, MA* | 24.8 | 77.7 | 360 | 143 | 30 |
| Providence-New Bedford-Fall River, RI-MA | 24.1 | 64.0 | 264 | 144 | 31 |
| Washington-Arlington-Alexandria, DC-VA-MD-WV* | 23.6 | 88.2 | 421 | 145 | 49 |
| Port St. Lucie-Fort Pierce, FL | 22.7 | 54.6 | 255 | 146 | 50 |
| St. George, UT | 20.5 | 46.9 | 273 | 147 | 33 |
| Hanford-Corcoran, CA | 20.0 | 46.2 | 246 | 148 | 34 |
| Ocean City, NJ | 19.9 | 64.1 | 400 | 149 | 32 |
| Las Vegas-Paradise, NV | 19.4 | 58.2 | 298 | 150 | 35 |
| Visalia-Porterville, CA | 18.2 | 44.1 | 248 | 151 | 36 |
| Naples-Marco Island, FL | 18.0 | 66.1 | 370 | 152 | 51 |
| Reno-Sparks, NV | 17.4 | 62.8 | 335 | 153 | 37 |
| Medford, OR | 16.8 | 52.9 | 278 | 154 | 38 |
| Bakersfield, CA | 16.5 | 48.1 | 268 | 155 | 39 |
| San Jose-Sunnyvale-Santa Clara, CA | 14.9 | 97.1 | 642 | 156 | 40 |
| Redding, CA | 14.6 | 49.0 | 272 | 157 | 41 |
| Miami-Miami Beach-Kendall, FL* | 13.6 | 48.3 | 265 | 158 | 52 |
| Barnstable Town, MA | 12.1 | 66.8 | 363 | 159 | 33 |
| Vallejo-Fairfield, CA | 11.8 | 74.0 | 450 | 160 | 42 |
| Yuba City, CA | 11.7 | 48.2 | 320 | 161 | 43 |
| Oxnard-Thousand Oaks-Ventura, CA | 10.8 | 79.5 | 591 | 162 | 44 |
| Santa Rosa-Petaluma, CA | 10.7 | 75.1 | 532 | 163 | 45 |
| Oakland-Fremont-Hayward, CA* | 9.4 | 83.8 | 555 | 164 | 46 |
| Fresno, CA | 9.2 | 47.0 | 297 | 165 | 47 |
| Riverside-San Bernardino-Ontario, CA | 8.4 | 57.5 | 385 | 166 | 48 |
| Madera, CA | 8.1 | 48.0 | 308 | 167 | 49 |
| Sacramento--Arden-Arcade--Roseville, CA | 7.9 | 65.4 | 400 | 168 | 50 |
| San Francisco-San Mateo-Redwood City, CA * | 7.8 | 91.2 | 745 | 169 | 51 |
| San Luis Obispo-Paso Robles, CA | 7.8 | 63.8 | 533 | 169 | 51 |
| Stockton, CA | 6.5 | 57.1 | 430 | 171 | 53 |
| Nassau-Suffolk, NY* | 6.1 | 91.0 | 475 | 172 | 34 |
| New York-White Plains-Wayne, NY-NJ* | 6.1 | 59.2 | 472 | 172 | 34 |
| Santa Cruz-Watsonville, CA | 5.9 | 75.1 | 672 | 174 | 54 |
| Napa, CA | 5.8 | 75.0 | 600 | 175 | 55 |
| Merced, CA | 5.5 | 46.4 | 365 | 176 | 56 |
| San Diego-Carlsbad-San Marcos, CA | 5.2 | 64.9 | 491 | 177 | 57 |
| Salinas, CA | 5.0 | 62.2 | 600 | 178 | 58 |
| Modesto, CA | 3.9 | 54.4 | 380 | 179 | 59 |
| Santa Barbara-Santa Maria, CA | 3.2 | 65.8 | 580 | 180 | 60 |
| Number | Thumbnail | Title | Author | Date | Votes | Views |
| 589 |

|

admin
|
2024.04.19
|
Votes 1
|
Views 55
|
admin | 2024.04.19 | 1 | 55 |
| 588 |

|

admin
|
2024.04.18
|
Votes 0
|
Views 64
|
admin | 2024.04.18 | 0 | 64 |
| 587 |
|

admin
|
2024.04.18
|
Votes 0
|
Views 49
|
admin | 2024.04.18 | 0 | 49 |
| 586 |
|

admin
|
2024.04.18
|
Votes 0
|
Views 48
|
admin | 2024.04.18 | 0 | 48 |
| 585 |

|

admin
|
2024.04.13
|
Votes 0
|
Views 72
|
admin | 2024.04.13 | 0 | 72 |
| 584 |

|

admin
|
2024.01.25
|
Votes 0
|
Views 312
|
admin | 2024.01.25 | 0 | 312 |
| 583 |

|

admin
|
2024.01.18
|
Votes 0
|
Views 247
|
admin | 2024.01.18 | 0 | 247 |
| 582 |

|

admin
|
2024.01.17
|
Votes 0
|
Views 242
|
admin | 2024.01.17 | 0 | 242 |
| 581 |

|

admin
|
2023.12.19
|
Votes 0
|
Views 268
|
admin | 2023.12.19 | 0 | 268 |
| 580 |

|

admin
|
2023.11.16
|
Votes 0
|
Views 431
|
admin | 2023.11.16 | 0 | 431 |
| 579 |

|

admin
|
2023.10.18
|
Votes 0
|
Views 380
|
admin | 2023.10.18 | 0 | 380 |
| 578 |

|

admin
|
2023.09.14
|
Votes 0
|
Views 396
|
admin | 2023.09.14 | 0 | 396 |
| 577 |

|

admin
|
2023.08.30
|
Votes 0
|
Views 508
|
admin | 2023.08.30 | 0 | 508 |
| 576 |

|

admin
|
2023.08.29
|
Votes 0
|
Views 342
|
admin | 2023.08.29 | 0 | 342 |
| 575 |

|

admin
|
2023.07.16
|
Votes 0
|
Views 502
|
admin | 2023.07.16 | 0 | 502 |