

전미 부동산 뉴스 통계 은행 이자 몰게지 주거용 상업용 부동산 정보
1년 이후 미 100대 도시 주택시세 전망 (Money Magazine)
(Money Magazine) -- The housing implosion is nowhere near over. In 75 of the 100 top U.S. cities, prices are expected to fall in the next 12 months according to Fiserv Lending Solutions.
The S&P Case/Shiller Home Price Index, which tracks 20 of the largest housing markets, showed prices plummeting by 12.7% in the 12 months ending February. That's the biggest fall since the index began tracking prices in 2000.
Meanwhile, foreclosure filings more than doubled in the first three months of 2008, spiking 112%. So far this year 156,463 families have lost their homes to repossessions. Many markets won't hit bottom till late 2009 or even 2010.
Pity the residents of Stockton, Calif., whose homes are likely to lose more than half of their 2006 value. But if you happen to live in Texas, congratulations: The housing tornado passed you by.
| Metro Area | Home Price (median) | Price Change (5 years) | Forecast (May '09) | % change in foreclosure rate (1 year) |
|---|---|---|---|---|
| McAllen, TX | $109,000 | 23.3% | 4.0% | 23% |
| Rochester, NY | $121,000 | 20.1% | 2.7% | 5% |
| Birmingham | $156,000 | 29.4% | 2.7% | 20% |
| Syracuse | $126,000 | 29.5% | 2.6% | 27% |
| Buffalo/Niagara Falls | $105,000 | 24.5% | 2.4% | 14% |
| New Orleans | $158,000 | 43.7% | 2.2% | 49% |
| Scranton | $128,000 | 41.1% | 2.2% | 8% |
| Baton Rouge | $170,000 | 38.3% | 1.9% | 14% |
| Grand Rapids | $124,000 | 8.3% | 1.9% | 37% |
| El Paso | $134,000 | 51.9% | 1.8% | 32% |
| Wichita | $114,000 | 17.8% | 1.5% | 9% |
| Tulsa | $128,000 | 18.8% | 1.4% | 5% |
| Fort Worth/Arlington | $134,000 | 17.4% | 1.4% | 16% |
| Indianapolis | $114,000 | 12.0% | 1.3% | 11% |
| Houston | $150,000 | 25.1% | 1.2% | 11% |
| Dallas | $161,000 | 15.8% | 1.2% | 14% |
| Gary, IN | $125,000 | 25.6% | 1.1% | 12% |
| Albany, NY | $200,000 | 64.1% | 0.9% | 10% |
| San Antonio | $152,000 | 39.6% | 0.8% | 22% |
| Greensboro, NC | $151,000 | 17.8% | 0.6% | 256% |
| Omaha | $136,000 | 17.7% | 0.6% | 71% |
| Little Rock | $128,000 | 28.4% | 0.5% | 405% |
| Louisville | $133,000 | 20.7% | 0.5% | 17% |
| Columbia, SC | $145,000 | 28.1% | 0.3% | 16% |
| Oklahoma City | $134,000 | 29.8% | 0.3% | 16% |
| Austin | $186,000 | 28.9% | -0.1% | -6% |
| Raleigh/Cary, NC | $236,000 | 26.4% | -0.2% | 62% |
| Charlotte, NC | $205,000 | 27.8% | -0.5% | 15% |
| Kansas City | $148,000 | 19.4% | -0.6% | 22% |
| St. Louis | $134,000 | 31.7% | -0.8% | 22% |
| Lake County, IL | $260,000 | 30.4% | -0.8% | N.A. |
| Pittsburgh | $144,000 | 18.1% | -1.3% | 1% |
| Memphis | $124,000 | 8.7% | -1.5% | 28% |
| Richmond | $226,000 | 61.4% | -1.8% | 72% |
| Milwaukee | $220,000 | 35.7% | -1.8% | 53% |
| Atlanta | $205,000 | 16.0% | -2.3% | 52% |
| Youngstown, OH | $87,000 | 2.8% | -3.0% | 3% |
| Nashville | $154,000 | 34.8% | -3.3% | 28% |
| Allentown, PA | $247,000 | 58.9% | -3.3% | 52% |
| Akron | $143,000 | 5.2% | -3.8% | 15% |
| Toledo | $122,000 | 1.9% | -4.0% | 12% |
| Cincinnati | $166,000 | 7.4% | -4.2% | 9% |
| Cleveland | $145,000 | 1.2% | -4.3% | 11% |
| Columbus, OH | $155,000 | 5.7% | -4.4% | 17% |
| Dayton | $125,000 | 7.7% | -4.4% | 10% |
| Knoxville | $144,000 | 35.6% | -5.2% | 39% |
| Minneapolis/St. Paul | $235,000 | 15.9% | -5.6% | 71% |
| Farmington Hills, MI | $175,000 | -7.5% | -5.9% | N.A. |
| Poughkeepsie, NY | $260,000 | 50.8% | -6.8% | 35% |
| Chicago | $279,000 | 29.2% | -6.8% | 9% |
| Virginia Beach | $236,000 | 90.1% | -7.1% | 33% |
| Cambridge, MA | $417,000 | 10.7% | -8.5% | 57% |
| Detroit | $120,000 | -6.3% | -8.6% | 41% |
| Peabody, MA | $365,000 | 10.4% | -8.8% | 9% |
| Sacramento | $330,000 | 23.3% | -8.9% | 210% |
| Seattle | $430,000 | 61.9% | -9.0% | 58% |
| Worcester, MA | $257,000 | 13.5% | -9.2% | 102% |
| Springfield, MA | $195,000 | 33.6% | -9.5% | 241% |
| Jacksonville | $197,000 | 47.7% | -9.6% | 130% |
| San Diego | $522,000 | 31.3% | -9.7% | 175% |
| Salt Lake City | $229,000 | 59.9% | -9.8% | 18% |
| San Francisco | $840,000 | 40.7% | -10.1% | 175% |
| Wilmington, DE | $259,000 | 50.9% | -10.3% | 145% |
| Boston | $363,000 | 13.4% | -10.5% | 57% |
| Albuquerque | $174,000 | 50.7% | -10.5% | 23% |
| Denver | $254,000 | 4.5% | -10.8% | 23% |
| Philadelphia | $200,000 | 50.0% | -11.1% | 29% |
| Providence | $275,000 | 32.0% | -11.6% | 107% |
| Oakland | $595,000 | 27.7% | -11.7% | 266% |
| Baltimore | $264,000 | 64.7% | -12.5% | 92% |
| San Jose | $750,000 | 38.7% | -12.5% | 347% |
| Hartford, CT | $249,000 | 29.1% | -12.6% | 51% |
| Bethesda, MD | $460,000 | 54.9% | -12.9% | 118% |
| Ventura County, CA | $577,000 | 42.7% | -13.1% | 240% |
| Tacoma | $283,000 | 64.3% | -13.2% | 68% |
| Washington, DC | $408,000 | 49.2% | -13.2% | 42% |
| New York City | $471,000 | 43.5% | -13.2% | 3% |
| Bakersfield, CA | $255,000 | 73.0% | -13.6% | 391% |
| Stamford, CT | $562,000 | 32.8% | -13.9% | 66% |
| New Haven | $260,000 | 36.3% | -14.2% | 83% |
| Fresno | $276,000 | 62.1% | -14.3% | 285% |
| Nassau/Suffolk, NY | $465,000 | 40.2% | -14.4% | N.A. |
| Portland, OR | $306,000 | 62.3% | -14.7% | 100% |
| Camden, NJ | $220,000 | 50.9% | -14.9% | 11% |
| Santa Ana, CA | $669,000 | 52.4% | -15.2% | 290% |
| Newark | $419,000 | 38.1% | -15.4% | -5% |
| Sarasota | $230,000 | 38.0% | -15.5% | 458% |
| Edison, NJ | $358,000 | 36.0% | -15.8% | 0% |
| Honolulu | $625,000 | 95.3% | -16.2% | 129% |
| Los Angeles | $528,000 | 67.7% | -16.8% | 261% |
| Stockton, CA | $341,000 | 17.8% | -16.8% | 379% |
| Tucson | $217,000 | 54.5% | -16.9% | 14% |
| Riverside, CA | $340,000 | 49.9% | -16.9% | 299% |
| Tampa | $200,000 | 52.1% | -17.1% | 281% |
| West Palm Beach, FL | $305,000 | 46.1% | -17.6% | 435% |
| Las Vegas | $277,000 | 60.8% | -18.3% | 2% |
| Phoenix | $237,000 | 60.9% | -18.3% | 9% |
| Orlando | $245,000 | 62.5% | -21.0% | 399% |
| Fort Lauderdale | $309,000 | 56.1% | -22.2% | 450% |
| Miami | $329,000 | 94.8% | -24.9% | 370% |
| USA | $206,000 | 32.7% | -9.7% | 65% |
| Number | Thumbnail | Title | Author | Date | Votes | Views |
| 454 |
|

admin
|
2018.12.10
|
Votes 0
|
Views 4171
|
admin | 2018.12.10 | 0 | 4171 |
| 453 |

|

admin
|
2017.03.16
|
Votes 0
|
Views 3008
|
admin | 2017.03.16 | 0 | 3008 |
| 452 |

|

admin
|
2017.03.15
|
Votes 0
|
Views 3200
|
admin | 2017.03.15 | 0 | 3200 |
| 451 |

|

admin
|
2017.01.26
|
Votes 0
|
Views 2260
|
admin | 2017.01.26 | 0 | 2260 |
| 450 |

|

admin
|
2016.11.02
|
Votes 0
|
Views 2223
|
admin | 2016.11.02 | 0 | 2223 |
| 449 |
|

admin
|
2016.10.28
|
Votes 0
|
Views 2395
|
admin | 2016.10.28 | 0 | 2395 |
| 448 |

|

admin
|
2016.10.19
|
Votes 0
|
Views 3496
|
admin | 2016.10.19 | 0 | 3496 |
| 447 |
|

admin
|
2016.10.02
|
Votes 0
|
Views 2531
|
admin | 2016.10.02 | 0 | 2531 |
| 446 |

|

admin
|
2016.09.27
|
Votes 0
|
Views 2426
|
admin | 2016.09.27 | 0 | 2426 |
| 445 |
美 기준금리 동결, FOMC "미국 경제 나아진다는 지표 더 나와야"…12월 인상 가능성 높아져
admin
|
2016.09.27
|
Votes 0
|
Views 2193
|
admin | 2016.09.27 | 0 | 2193 | |
| 444 |
미국 3월 기존주택판매 5.1%↑…"고용증가·저금리 덕"
admin
|
2016.04.20
|
Votes 0
|
Views 2389
|
admin | 2016.04.20 | 0 | 2389 | |
| 443 |
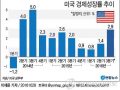
미국 2분기 GDP 3.7% 성장…예상치 넘어서
admin
|
2015.08.27
|
Votes 0
|
Views 2387
|
admin | 2015.08.27 | 0 | 2387 | |
| 442 |
집 살 돈은 없고 집세는 치솟고…미국 젊은 세대도 같은 고민
admin
|
2015.06.14
|
Votes 0
|
Views 2985
|
admin | 2015.06.14 | 0 | 2985 | |
| 441 |
"공급이 달리니…집값은 꾸준히 오를 수밖에"
admin
|
2015.05.04
|
Votes 0
|
Views 3150
|
admin | 2015.05.04 | 0 | 3150 | |
| 440 |
美양적완화 월 450억弗로 줄어…초저금리 유지
admin
|
2014.04.30
|
Votes 0
|
Views 2737
|
admin | 2014.04.30 | 0 | 2737 |